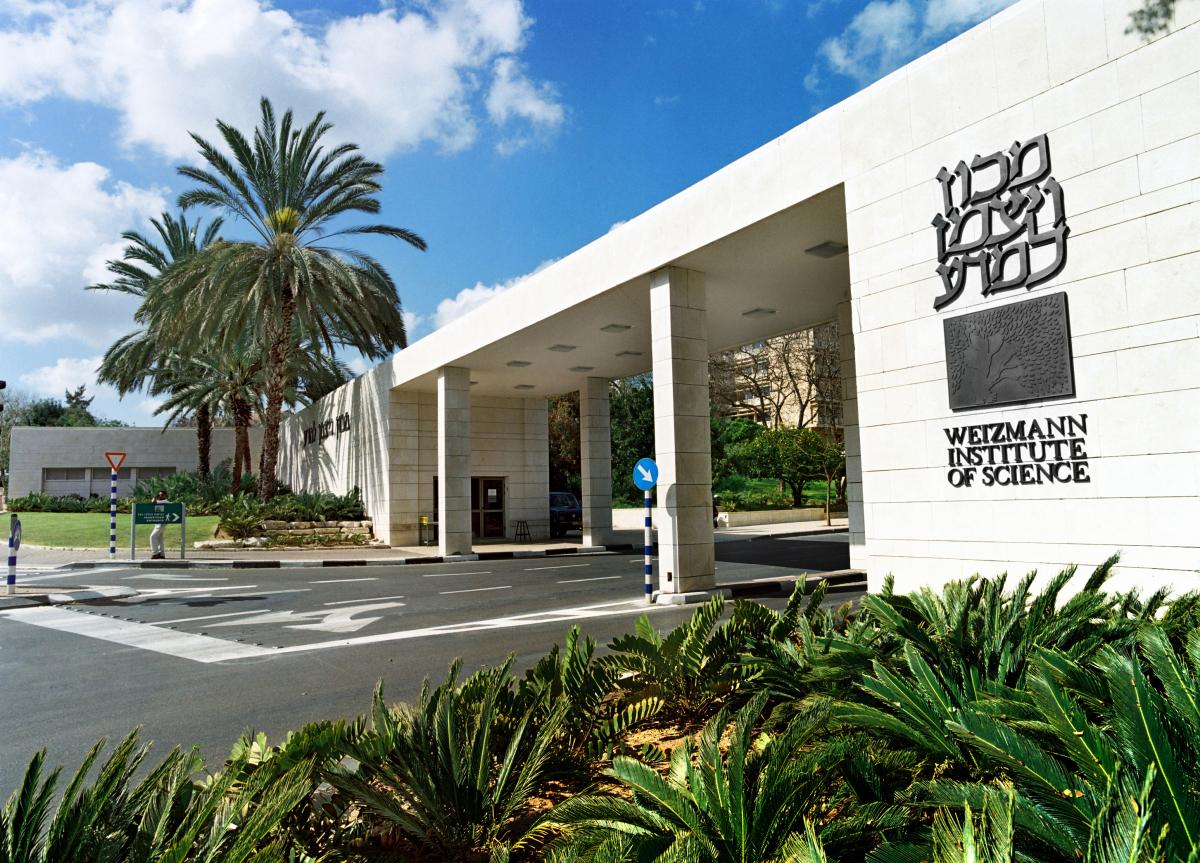
Calibrating photo multiplier tubes to detect dark matter (Weizmann Institute summer camp)

To prove the existence of dark matter, you need to detect super-radiation from particles under specific conditions. My team's task was to calibrate very senesitve light sensors (called photo-multiplier tubes or PMTs) so we could analyse where the radiation was coming from.
This all happened over two weeks in the summer of 2019 at the Weizmann institute of technology in Israel.
In this project we had to:
- Build a program which analysed data from photo-multiplier tubes,
- Present our work, and
- Write a report of the work we did
The technical side
There are a lot of interesting details about how superradiation could be used to prove the existence of dark matter. If you would like, you can view the full article.
Collecting Data
The actual process of collecting the data is complicated, and out of scope for this article. Once the data is collected, it is parsed by a data logger which writes all the collected data into a file of a custom 'DXD' format.

Once this file is saved, we can start running analysis on it.
The file is essentially a spreadsheet which contains the light readings from each photo-multiplier tube. They look something like this:

Processing data
There were several steps we had to take to process this data.
Filter noise
The data had lots of noise, so we used NumPy to clean it up.
Integrate
We then calculate the area under the signal-time graph to find the main signal. The first signal is the trigger.
Find the peak
Once we have the graph, we need to find the peak of it using a curve fitting function built into SciPy. We used a Gaussian curve to model the curvature of the signal-time graph.
Finding time disparity
We can calculate the peak's start point - trigger point, and use some trigonometry to find how long it took for the photon to reach the photo-multiplier tube.
Although we didn't get around to properly doing step 4 due to time constraints, we still managed to get a good understanding of the project and its unique challenges.
The (messy) code is available on GitHub
Using the data
Once we had processed the data and understood the process, we were ready for our presentation.
We had about ten minutes to present, with a few more minutes for questions. We had to articulate our complicated research over the two weeks to a general audience. However, there were some professors too, so we had to ensure what we said was accurate.
Also, we had to write up a report explaining our research. This was very insightful as it was the first time I had to write a report document about a computer science project, which is often done in academia.
The social side

The amazing view from the observatory, previously a particle accelerator
Although I did learn a lot about Python programming and data analysis, I think that a big part of what I learned was from the people around me. They were intelligent, interesting, and remarkable.
We still keep in contact and have met up a few times after to celebrate that amazing summer, playing ping pong and programming.